Urban & Rural Context

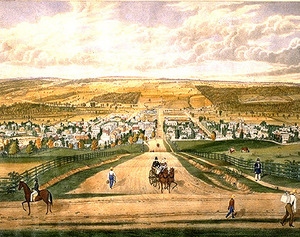
Ithaca, NY 1836
Methodologies for Allocating Urban & Rural Shares of JARC and New Freedom Projects- 2013
Public Transit Availability in Tompkins County - 2008 (To be updated in 2016)
Public Transit Availability in Tompkins County - 2008 (To be updated in 2016)
The distribution of people, housing, jobs, food, education, health and other services and means of transportation are essential facts for identifying and understanding service gaps and needs in Tompkins County. This section discusses issues relating to urban and rural populations, labor force and availability of mobility services. The distribution of target populations of people with disabilities, limited income and seniors across Tompkins County needs to be identified. Further, the distribution of high-speed Internet and mobile communications, essential for people to reliably use community mobility services, needs to be identified. The Urban-Rural divide is a "Big Picture" useful for evaluating options for mobility services for target populations of people with disabilities, limited income and seniors.
Methodologies for Allocating Urban and Rural Shares of JARC and New Freedom Projects - 2013

The JARC allocation is based on Tompkins County’s 2010 Labor Force, while New Freedom projects are allocated based on the County’s 2010 Population, shown in the Table A.
Job Access and Reverse Commute (JARC), by definition, directly relates to the labor force population, especially to increasing and sustaining employment for low-income persons. Tompkins County is unique in the Southern Tier because the majority (57%) of its labor force is rural and 20% (14,900 workers) commute from other counties. Accessing a rural labor force is essential for Tompkins County to continue to grow as a regional economic center in the Southern Tier. A 2008 labor market study identified a significant labor shortage of basic-skilled workers in Tompkins County.[4] Further, the local high cost of living and limited affordable housing dampens the ability to attract basic-skilled workers. Therefore, businesses look to recruit rural labor force who cannot afford to, or desire to, live in the County. [5]
[2] http://www.gpo.gov/fdsys/pkg/FR-2012-03-27/html/2012-6903.htm
[3] 2010 American Communities Survey & http://www.tompkins-co.org/itctc/Statistics/Journey-to-Work/County_NonResInCommuteWorkforce2008.pdf
[4] The Tompkins County Labor Market Region Study. Chmura Economics & Analytics. 2008. P. 7.
http://www.tompkinsworkforceny.org/LaborExecSum08.pdf
[5] Ibid. p. 7.
Public Transit Availability in Tompkins County - 2008
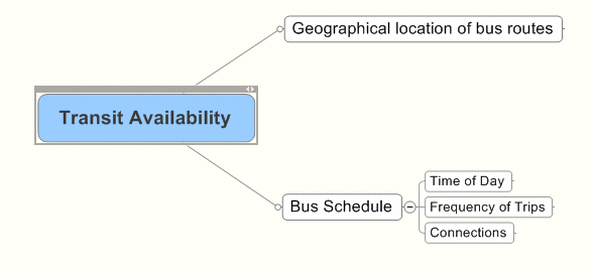
Assessing the availability of public transit service involves comparing bus routes and bus stop locations, the frequency and time of day of bus service (bus schedules) in relationship to total population, low income, senior and persons with disabilities populations living within 1/4 mile of routes, employers and public services served.
In 2008, a preliminary GIS analysis was performed by overlaying TCAT bus routes with general and senior populations by municipality in order to determine the percent of the populations located within 1/4 mile of bus routes. The population data was the 2000 Census. The TCAT system map of 2007 were the bus routes used. This was before the newest TCAT Transit Development Plan was put into effect in 2009.
The detailed results are shown in the Excel file below.
The results were the Ithaca Urban Area had 88% of the general population located within 1/4 mile of a TCAT bus route, while 31% of rural town households were as conveniently close to bus routes. This was strictly a geographical coverage assessment. It did not include an assessment of the level of bus service as shown in bus schedules.
This assessment needs to be redone with 2010 Census data and the current TCAT system map.
| pop_pct_within_bus_corridor_2.xls | |
| File Size: | 25 kb |
| File Type: | xls |
Frequency of Bus Service - Urban and Rural

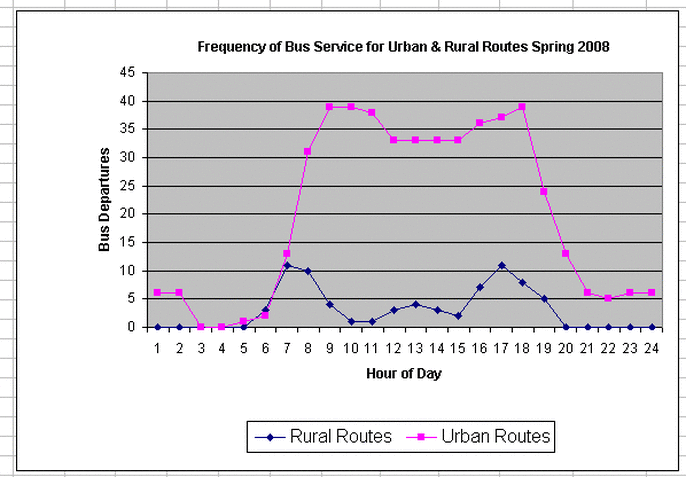
This chart shows the frequency of bus service, as represented by the number of outbound bus departures, for each one hour period for weekdays in 2008.
Urban routes (magenta) has buses in service 22 hours per day. There are nearly 40 bus departures at the height of the morning and afternoon peak periods.
Rural routes (blue) have about 25% of the bus departures as urban routes during the am and pm peak hours.
Urban routes (magenta) has buses in service 22 hours per day. There are nearly 40 bus departures at the height of the morning and afternoon peak periods.
Rural routes (blue) have about 25% of the bus departures as urban routes during the am and pm peak hours.
| tcat_service_availability_spr_2008.xls | |
| File Size: | 48 kb |
| File Type: | xls |


